Applying Reduced-Order Modelling Techniques to a Tuning Fork
A Brief Synopsis
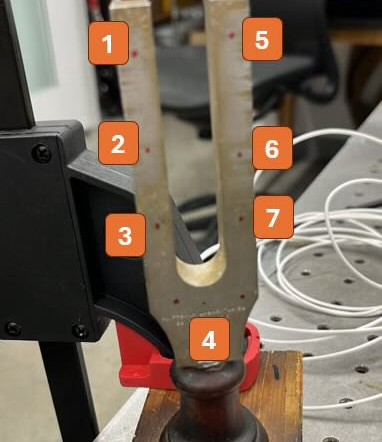
In this project, reduced order modelling is performed to determine best fit state space matrices for a tuning fork. Impulse responses are generated using roving accelerometer on the points marked in the diagram while impact hammer is struck on point 4. Accordingly, 7 impulse responses are generated. Firstly, a proof of the existence of lower order POD modes is shown using singular value decomposition. As expected the POD modes mimic the vibrational mode shapes of the tuning fork. Following this, the state space matrices are generated using Eigensystem Realization Algorithm and the results are analyzed.
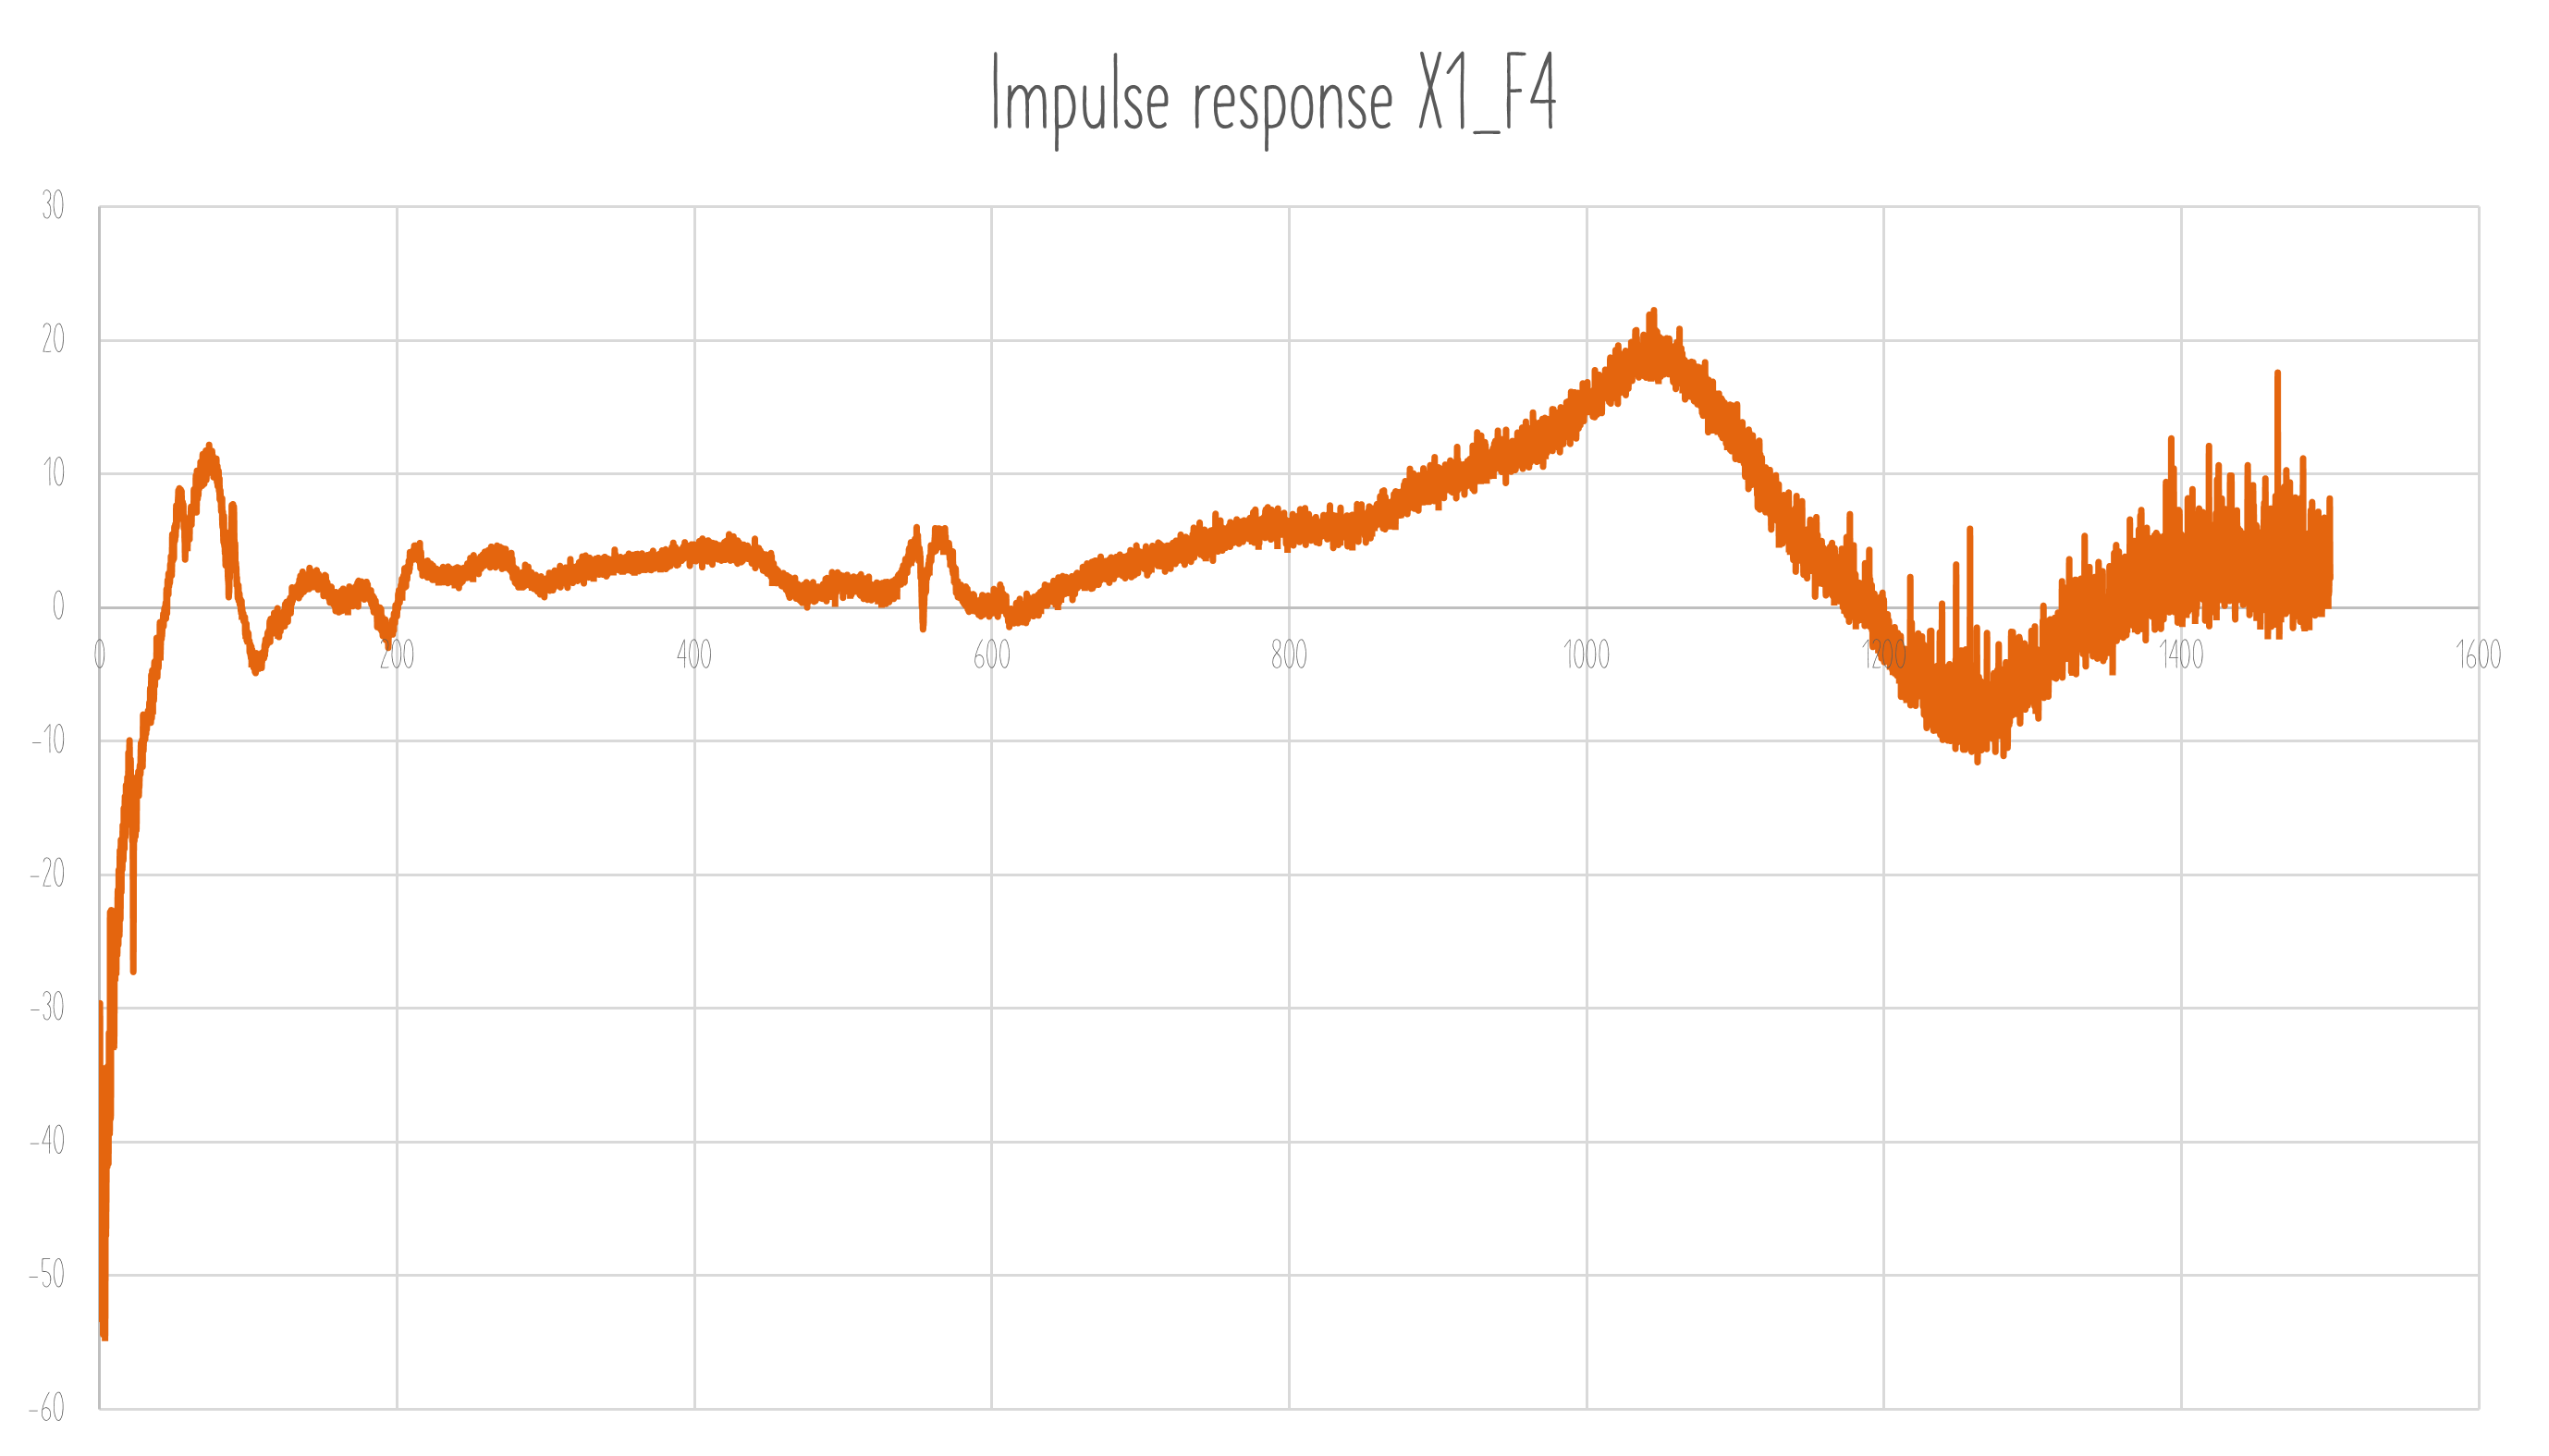
1. Examle of impulse response X1_F4
An example of one of the impulse response is shown below.
2. Principle Component Analysis Using Singular Value Decomposition
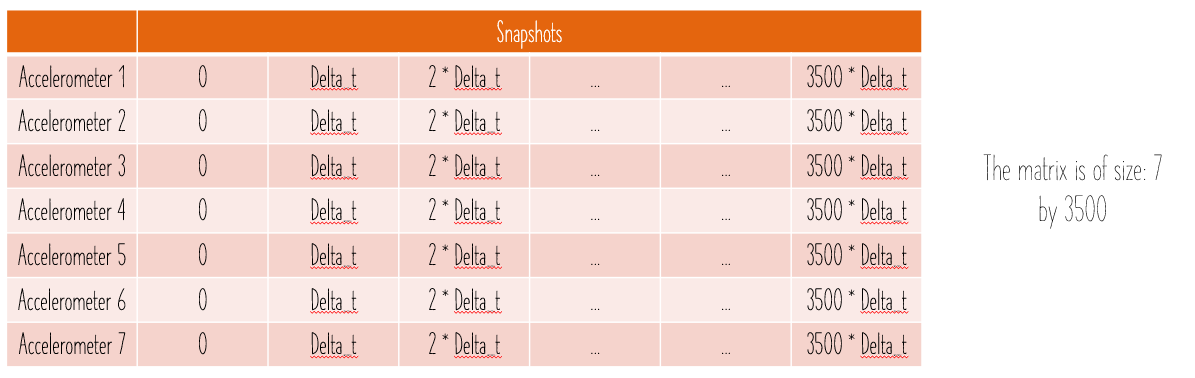
To obtain the lower order POD modes, the impulse responses are structured as a matrix shown below. Each row represents the accelerometer location and each column represents snapshot in time.
SVD is performed on the data matrix and the first 10 modes are kept for the purposes of truncation. The POD modes with decreasing importance are shown below.

3. Deriving State Space Using Eigensystem Realization Algorithm
Next, the state space matrices are generated to best fit the impulse response. Henkel matrices are generated and then SVD is performed. A graphic representation of the POD modes and the cumulative energy by adding each POD mode is shown below.
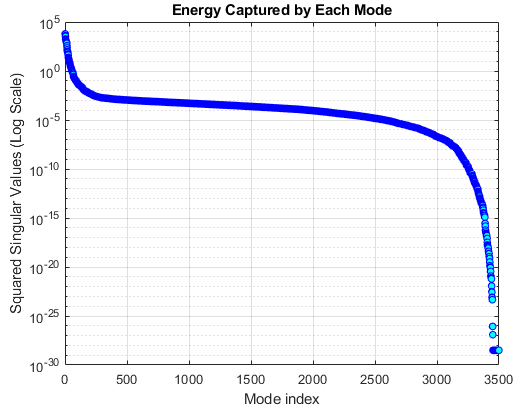
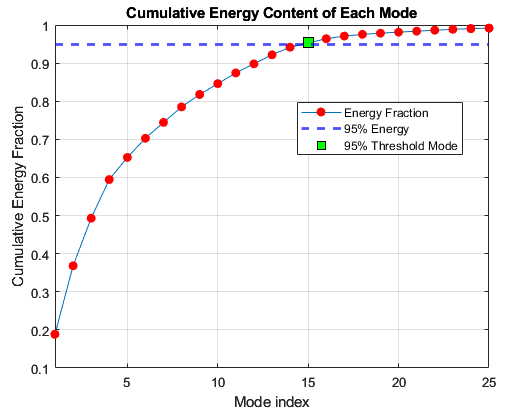
As shown, first 15 POD modes encapsulate 95 % of the total energy. Using this info, ERA procedures are performed to get the state space matrices and the results with different truncation are shown below. As expected, adding more POD modes to the ERA procedures allows for a better fit to the data. It is to be noted that the magnitude of the reconstructed impulse response is twice that of the original. This is because the actual impulse response is not generated with a perfect unit impulse. On the other hand, reconstructed impulse response is due to a perfect unit impulse.

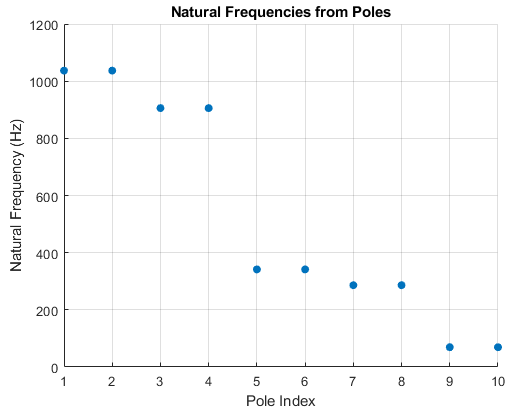
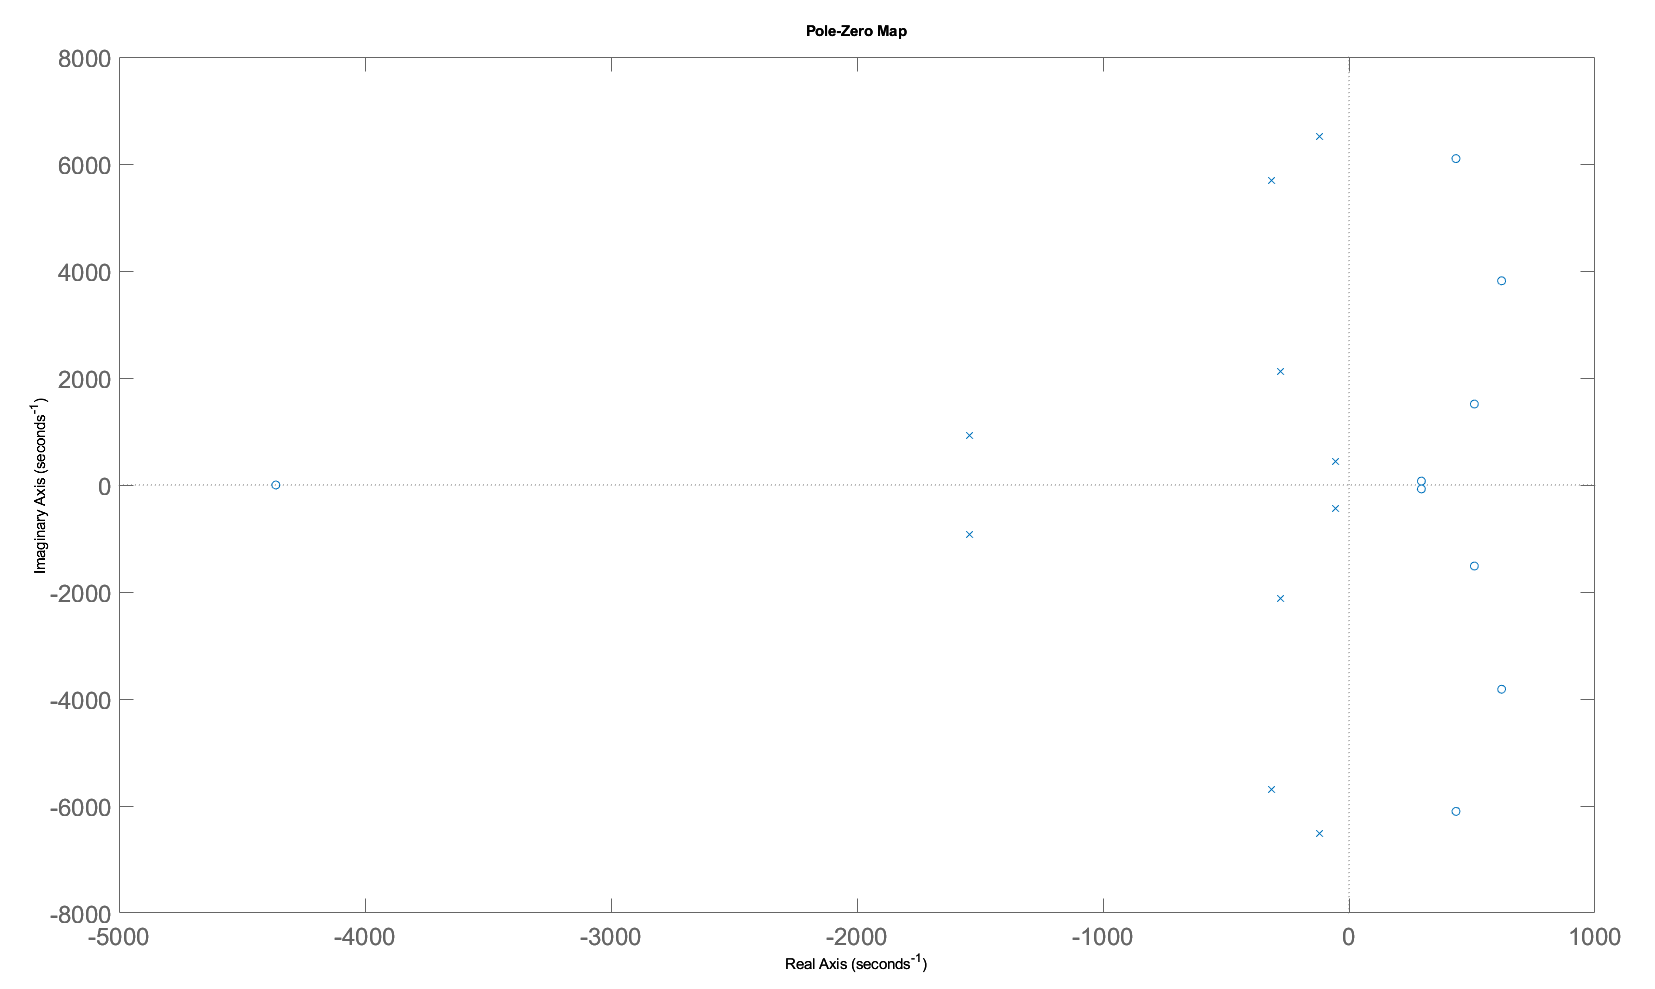
First 10 POD modes are used for the ERA and the state space matrices are determined. Now, we can get to analyzing the system. The poles of the system are shown below. The pzmap shows the poles are in left half plane with large real and imaginary parts, corresponding to fast decay and large oscillations.
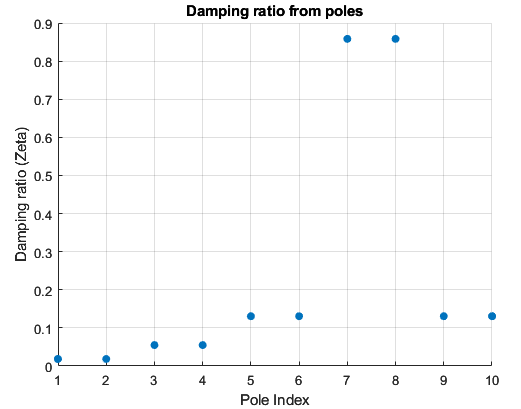
Based on the poles, the damping ratios and natural frequencies are shown below. VOILA! We see the natural frequency of 1025 Hz corresponding the resonance peak in the original response. Moreover, the damping ratio corresponding to that peak is the lowest showing that it is the resonance peak.